


Who Trusts INSEE’s Data?
INSEE regularly conducts surveys among various target groups to measure its reputation and image , as well as user satisfaction with its data. In 2023, more than 8 out of 10 respondents said that the institute inspires confidence and provides essential information for analysing the economic and social situation. However, despite this high overall level of trust, some gaps remain, especially among less connected and less educated citizens. This highlights the need to make statistics more accessible, easier to find, and easier to understand.
In 2023, INSEE introduced an innovative component in its surveys, designed in collaboration with two sociolog ists, in order to identify and quantify the factors influencing trust or distrust in its indicators
it publishes. The first finding of this component is that the French have a fairly accurate understanding of the main indicators describing the economy and society, with rare exceptions. These exceptions are often due to the complexity of the measures (e.g., salary statistics) or the low prevalence of the topic in public debate (e.g., the proportion of people with no religion). The second finding is that trust in the institute increases with education level and income. In addition, political orientation might have some influence on trust in indicators, while susceptibility to conspiracy theories would play only a minor role. Interestingly, a more analytical style of thinking, as opposed to an intuitive one, is associated with fewer errors in estimating tested values.
INSEE conducts various surveys each year to measure its reputation, the quality of its public image, and user satisfaction with its data, publications, and products. Since June 2017, the institute has conducted a monthly survey of visitors to its website, insee.fr. It also commissions two annual surveys: one conducted online and the other by telephone, targeting audiences with little or no access to internet. Each year, some 25,000 people give their opinions, feedback, and suggestions. This feedback, combined with satisfaction measurements from direct interactions between INSEE and its users, feeds into performance and service quality indicators. These metrics are made available to the public, in line with transparency requirements for public services.
Overall, a Good Level of Trust in INSEE
Positive points: INSEE is considered useful by 9 out of 10 respondents. It inspires trust and provides essential information for analyzing the economic and social situation for 8 out of 10 respondents (Figure 1). Its reputation and image are particularly strong among the internet-connected population: more than 9 out of 10 respondents know INSEE at least by name, and 9 out of 10 also have a fairly good or very good opinion of it. This is less the case for those who are less or not at all connected: 7 out of 10 know the institute, and 6 out of 10 have a favourable opinion of it.
Figure 1 – Opinion on INSEE in December 2023
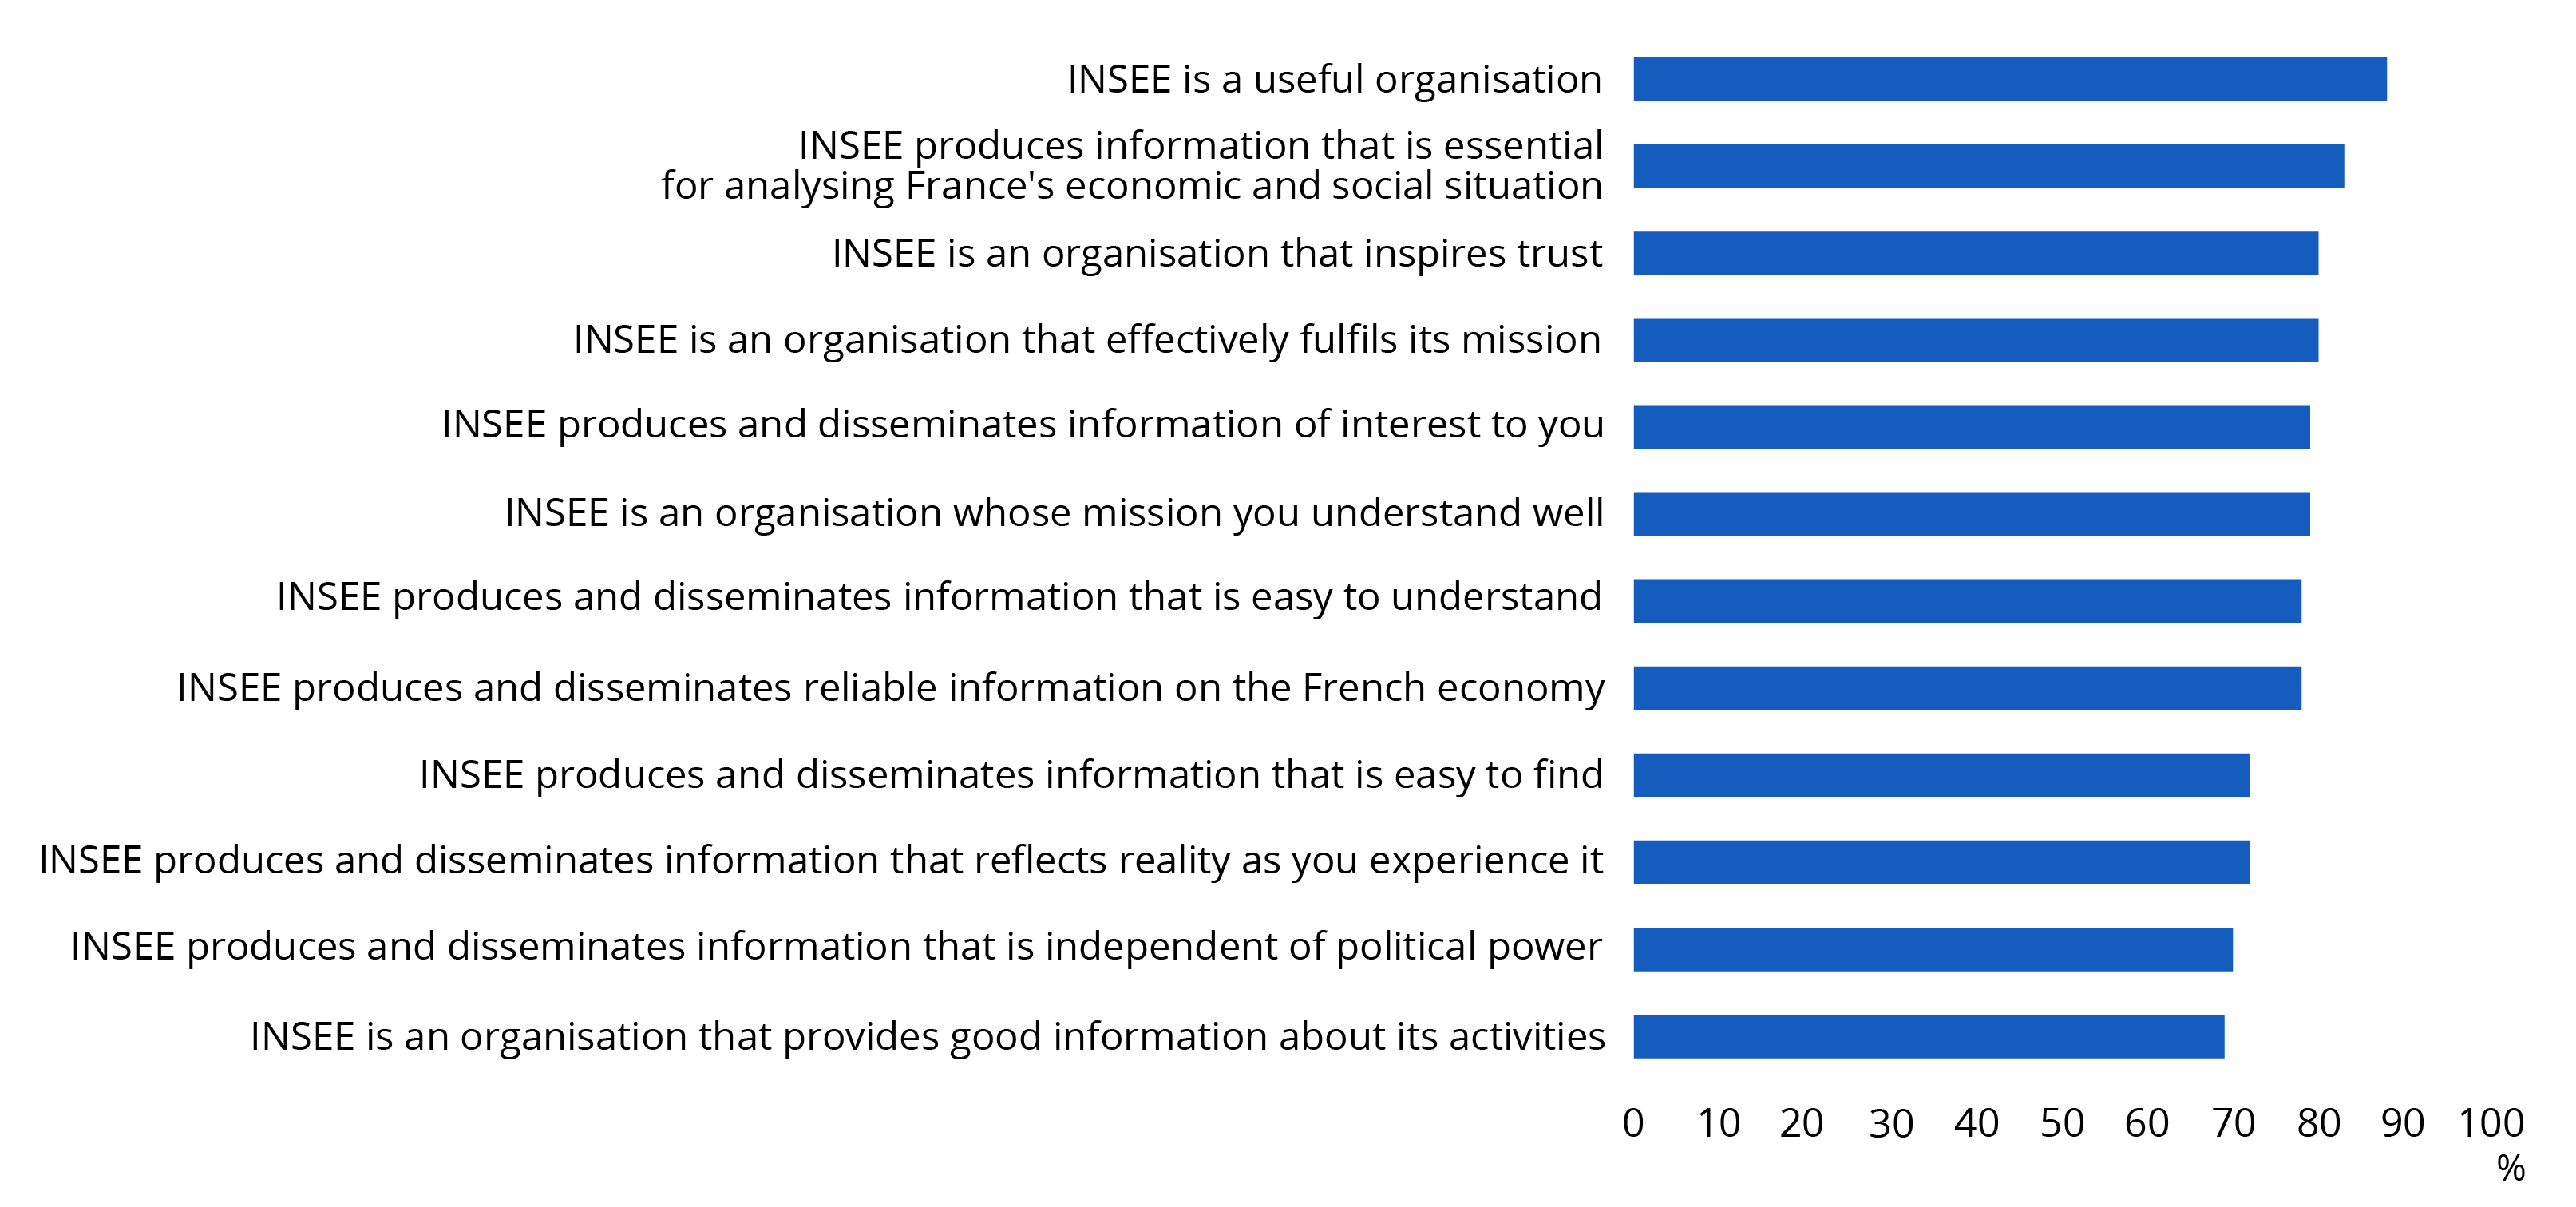
Reading: for 88% of people questioned in December 2023, INSEE is a useful organisation.
Source : survey on the general public image of INSEE, online, Harris Interactive.
As regards other national statistical institutes (NSIs), measuring satisfaction with their dissemination websites or their products and services is quite common. However, the measurement of overall satisfaction and trust in NSIs is less frequently published. The ONS (United Kingdom), for example, reported in a survey completed in early 2024 that 84% of users consider it trustworthy, while Istat (Italy) reported a 93% trust level in its statistics based on a survey focusing on its website at the end of 2022. Eurostat, in its October 2023 barometer (conducted with 26,000 EU citizens), reported scores of 69% for its recognition, 67% for trust in its statistics and data, and 65% for its objectivity and impartiality.
For INSEE, beyond the reassuring measure of overall trust, a more detailed examination of trust in different indicators paints a more nuanced picture. Users’ opinions and suggestions are particularly valuable as they help to identify areas for improvement.
First Area for Improvement regarding specific indicators: Raising Awareness
Population, number of children per woman: year after year, trust in sociodemographic indicators is generally strong (Figure 2). However, trust is lower for economic indicators, particularly unemployment rates, inflation, and purchasing power.
Figure 2 – Trust in INSEE Indicators in December 2023
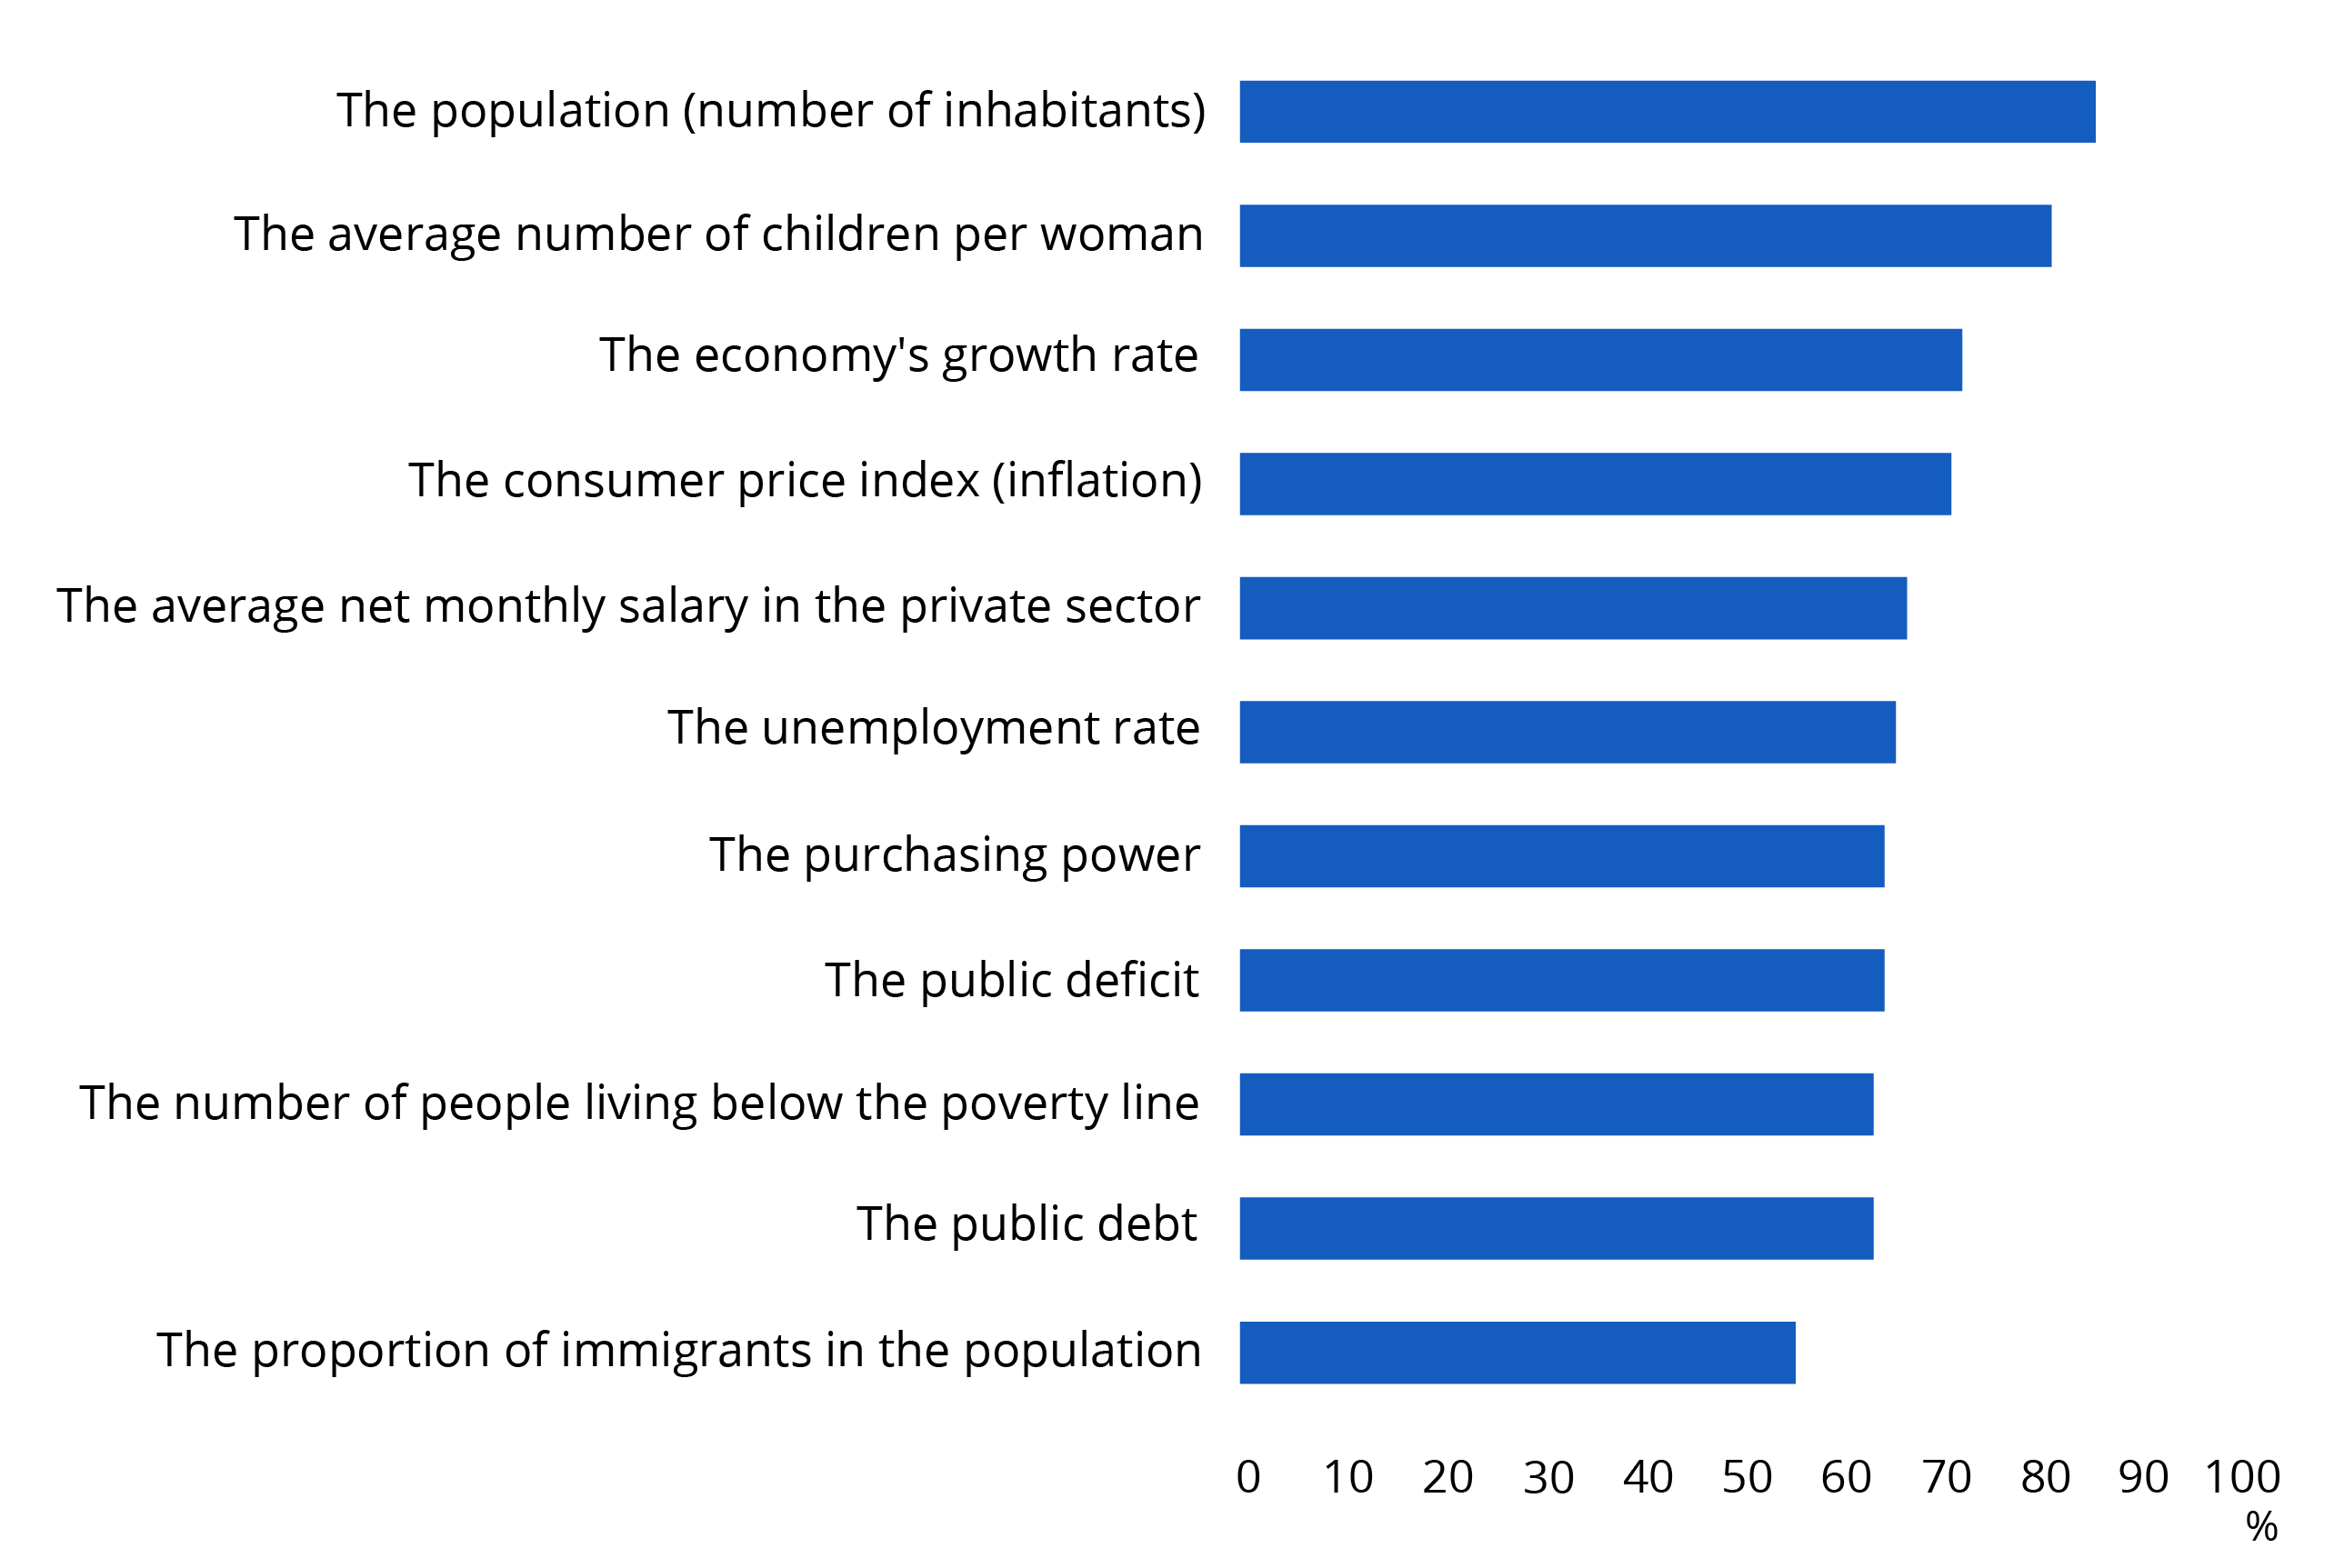
Reading: for 77% of people questioned in December 2023, the population figure accurately reflects reality in France.
Source: survey on the general public image of INSEE, online, Harris Interactive.
The verbatim comments accompanying the negative assessments express various types of criticism: some point out the limitations of the indicators or the lack of additional information due, for example, to technical, regulatory, or budgetary obstacles, while others deplore the absence of data that do exist but are sometimes difficult to find among the wealth of information available on insee.fr.
For exemple:
• The confusion between the unemployment rate calculated by INSEE following the rules of the International Labour Organization and the number of jobseekers published by France Travail, dissected on this blog (Passeron, 2022).
• Criticisms of the composition of the shopping basket used to measure inflation, or more directly, the level of inflation calculated by INSEE.
This suggests, and you confirm, that we need to make progress in informing you about our activities and helping you find this information. Nearly 7 out of 10 of people with regular access to internet and fewer than half of those with limited or no access to internet think INSEE communicates well about its activities. While this result is improving, it is still far from being a strong point. A similar proportion feel our information is easy to find, with the main difficulty being sorting through the many datasets available.
Second area for improvement: better communication for a better general understanding
Those of you who trust us the least are the least “connected”: INSEE inspires trust in 6 out of 10 people who are poorly or not at all connected, with 4 out of 10 interested in our information and only 2 out of 10 knowing our missions. Among the connected individuals, trust in INSEE varies primarily according to educational level, reaching 9 out of 10 for those with a “bac +5” and falling to 7 out of 10 for those with no qualifications. Trust improves slightly with age, with about 75% of those under 35 and 82% of those over 35 trusting us, with very small differences within these two groups. Finally, the socio-professional category does not influence trust, with no category deviating significantly from 8 out of 10.
Measuring these differences reinforces the need for the institute to invest in better reaching different audiences. Statistical publications sometimes have a difficulty in summarizing, simplifying, or offering shortcuts. Clear written communication for the general public remains a challenge for INSEE and other public statistical offices. As for the usability of our websites and public applications, the upcoming redesign of insee.fr will aim to simplify the user experience (“UX” approach), while continuing to improve digital accessibility.
Sociological expertise to better understand the determinants of trust
At the end of 2023, the usual surveys on INSEE’s reputation and image were supplemented by a new survey, designed with two sociologists: Professor Bronner and Dr. Cordonier. This survey included new questions and a different approach to understanding trust in indicators, in order to better understand the factors that influence this trust. This additional survey was conducted online with 2,000 people by an external provider.
For 17 indicators published by INSEE (the 11 indicators of the classical survey, plus the fertility of immigrant, and the proportion of different religions in the population), respondents were first asked to state what they thought the value of the indicator was in France. They were then shown the value published by INSEE and asked whether, on a scale of 1 to 10, they thought this figure truly reflected what was happening in France.
The first surprise of the survey, was that, for many indicators, including the most widely publicized ones like the unemployment rate, growth rate, or inflation, the respondents’ spontaneous answers were accurate, reflecting a solid general knowledge of these topics. However, the spontaneous estimate of the average salary was significantly lower than the value published by INSEE, by almost 1,000 euros. This can be explained by several factors, including the difficulty of taking part-time work into account and the complexity of the concept of salary, which can be approached through various measures: gross salary, net salary, salary after tax, taking into account or not working hours, etc. The distribution of the population by religion was another data point that was poorly estimated spontaneously by respondents. The proportion of people with no religion, which is rarely discussed, was significantly underestimated, with 1 in 4 respondents believing it to be much lower, whereas it affects more than 1 in 2 people between 18 and 59 years old, according to the most recent data available.
The second surprise, which is more positive for the institute, is that for each indicator, on average, respondents trusted the value given to them. More generally, trust in the 17 indicators was strongly correlated with general trust in INSEE, although it was not possible to determine whether one explained the other. Specifically, the more educated a person is and the higher their income, the greater their trust in INSEE and in most indicators. Surprisingly, age plays a contradictory role: older people have more trust in the institute in general, but slightly less trust in certain indicators.
This survey also explored new parameters: the political orientation of the respondents, their thinking style (more analytical and slow-thinking or more intuitive and fast-thinking), and their sensitivity to conspiracy theories. Respondents’ thinking style was assessed using a cognitive psychology test, consisting of short riddles, each with an intuitive wrong answer and a correct, non-intuitive answer (Frederick, 2005; Thomson & Oppenheimer, 2016). To assess participants’ sensitivity to conspiratorial beliefs, we administered the “Conspiracy Mentality Questionnaire” (Bruder et al., 2013), a standardised psychometric scale in which respondents were asked to rate five general statements, such as “There are secret organisations that greatly influence political decisions.”
For respondents with the same sociodemographic profile, their intuitive/analytical thinking style significantly explains the over- or under-estimation of a number of indicators: unemployment rate, inflation rate, average salary, growth rate, birth rate, people with no religion. In particular, people with an analytical thinking style are less likely to over- or under-estimate these indicators.
If we focus on trust in indicators, and keep the sociodemographic profile identical, political orientation is the parameter with the most significant impact. For instance, compared to people who consider themselves politically centrist, those who do not know their political orientation, do not declare a political affinity, or identify with the extreme-right have less trust in many indicators: inflation rate, growth rate, purchasing power, poverty, annual deficit, percentage of people with no religion, immigrant fertility, immigrant population. This is also the case for those who identify with the far-left and left, especially when it comes to the average salary and the unemployment rate.
Sensitivity to conspiracy theories, however, did not significantly affect trust, except for the annual public deficit rate (where it had much less impact than political orientation). INSEE’s deontological stance, its values of neutrality and objectivity, seem to be well understood and accepted by the French public. However, maintaining and even improving citizens’ confidence in INSEE’s work remains a constant concern: it is an essential condition for producing reliable statistics that are useful for public debate. ■
Additional information
- Blanchet D., 2020 « Pouvoir d’achat et inégalités : les chiffres et le ressenti sont-ils aussi divergents qu’on le dit ? », Le Blog de l’Insee, mars
- Bruder M., Haffke P., Neave N., Nouripanah N., Imhoff R., 2013 « Measuring individual differences in generic beliefs in conspiracy theories across cultures: Conspiracy Mentality Questionnaire », Frontiers in psychology, vol. 4, art. 225, avril
- Daubaire A., 2023, « Shrinkflation, « effet qualité », évolution de l’offre de produits : comment l’Insee mesure-t-il le juste prix ? », Le Blog de l’Insee, décembre
- Frederick S., 2005, « Cognitive reflection and decision making », Journal of Economic Perspectives, vol. 19, n° 4 (pp. 25-42)
- Ourliac B., 2020, « Chômage : les Français mentent-ils aux Français ? », Le Blog de l’Insee, février
- Ourliac B., 2020, « Mais si, l’Insee prend bien en compte le logement dans l’inflation ! », Le Blog de l’Insee, février
- Passeron V., 2022, « Tout demandeur d’emploi n’est pas forcément chômeur », Le Blog de l’Insee, février
- Thomson K. S., Oppenheimer D. M., 2016, « Investigating an alternate form of the cognitive reflection test », Judgment and Decision Making, vol. 11, issue 1 (pp. 99-113), janvier
Photo credits: © frender – stock.adobe.com


